
Research · Housing and homelessness
What explains homelessness across U.S. communities?
Across 382 U.S. communities, housing and behavioral-health measures together account for about one-third of the variation in 2025 homelessness rates. The comparison is ecological and crosswalk-sensitive.
The question
Why do some communities have far more homelessness per person than others? Two stories compete for the explanation. One says housing markets — rents, rent burdens, vacancy — set the rate. The other says behavioral-health prevalence — mental illness and substance use in the general population — tracks it.
We tested both stories head-to-head across 382 Continuums of Care (CoCs), the local bodies HUD uses to count and coordinate homelessness response, using the January 2025 Point-in-Time count. The short answer: housing-market variables are the most consistent ecological predictors of cross-community variation. Together, housing and behavioral-health indicators account for about one-third of the variation in homelessness rates across CoCs. The behavioral-health block's contribution is real but smaller — and it survives an independent check, so it is not just a measurement artifact of one survey.
Everything here is descriptive and ecological. These are associations across communities, not statements about individuals — a community-level pattern cannot be read as a fact about any person experiencing homelessness. We report 95% intervals, not p-value gates, and we never say "drives."
What this is — and what it isn't
This analysis is a replication using newer data, with careful attention to measurement and inference limits. Prior community-level studies have repeatedly found that local housing conditions are associated with geographic variation in homelessness, including Honig & Filer (1993), Hanratty (2017), Glynn, Byrne & Culhane (2021), and Colburn & Aldern (2022). Hanratty analyzed 399 HUD Continuum of Care communities and found median rent positively associated with homelessness rates in cross-sectional models.
This report uses post-2020 CoC-level data and puts housing and behavioral-health measures in one model on the same geography. Replication on updated data helps show whether a finding holds across time and context.
The data
- Outcome: January 2025 Point-in-Time counts by CoC (HUD), 745,652 people counted nationally — 479,332 sheltered, 266,320 unsheltered. Counts are a lower bound. In a 2005 New York City study, counters missed decoys at 17 of 58 research sites (29% of sites). In a separate sample of 293 unsheltered service users, 31% were reported as definitely not visible to counters and 10% were uncertain. These sample findings do not estimate a national share (Hopper et al., 2008).
- Housing predictors: 2020–2024 American Community Survey 5-year estimates — median gross rent, rent burden (≥30% and ≥50% of income), rental vacancy, median household income, and poverty rate — apportioned from counties to CoCs by block-group population weights.
- Behavioral-health predictors: 2021–2023 National Survey on Drug Use and Health substate estimates — any mental illness, serious mental illness, and substance use disorder among adults 18+.
The median CoC homelessness rate is 13.6 per 10,000 people; the 95th percentile is 60.5, and the highest is 148.1 (New York City).
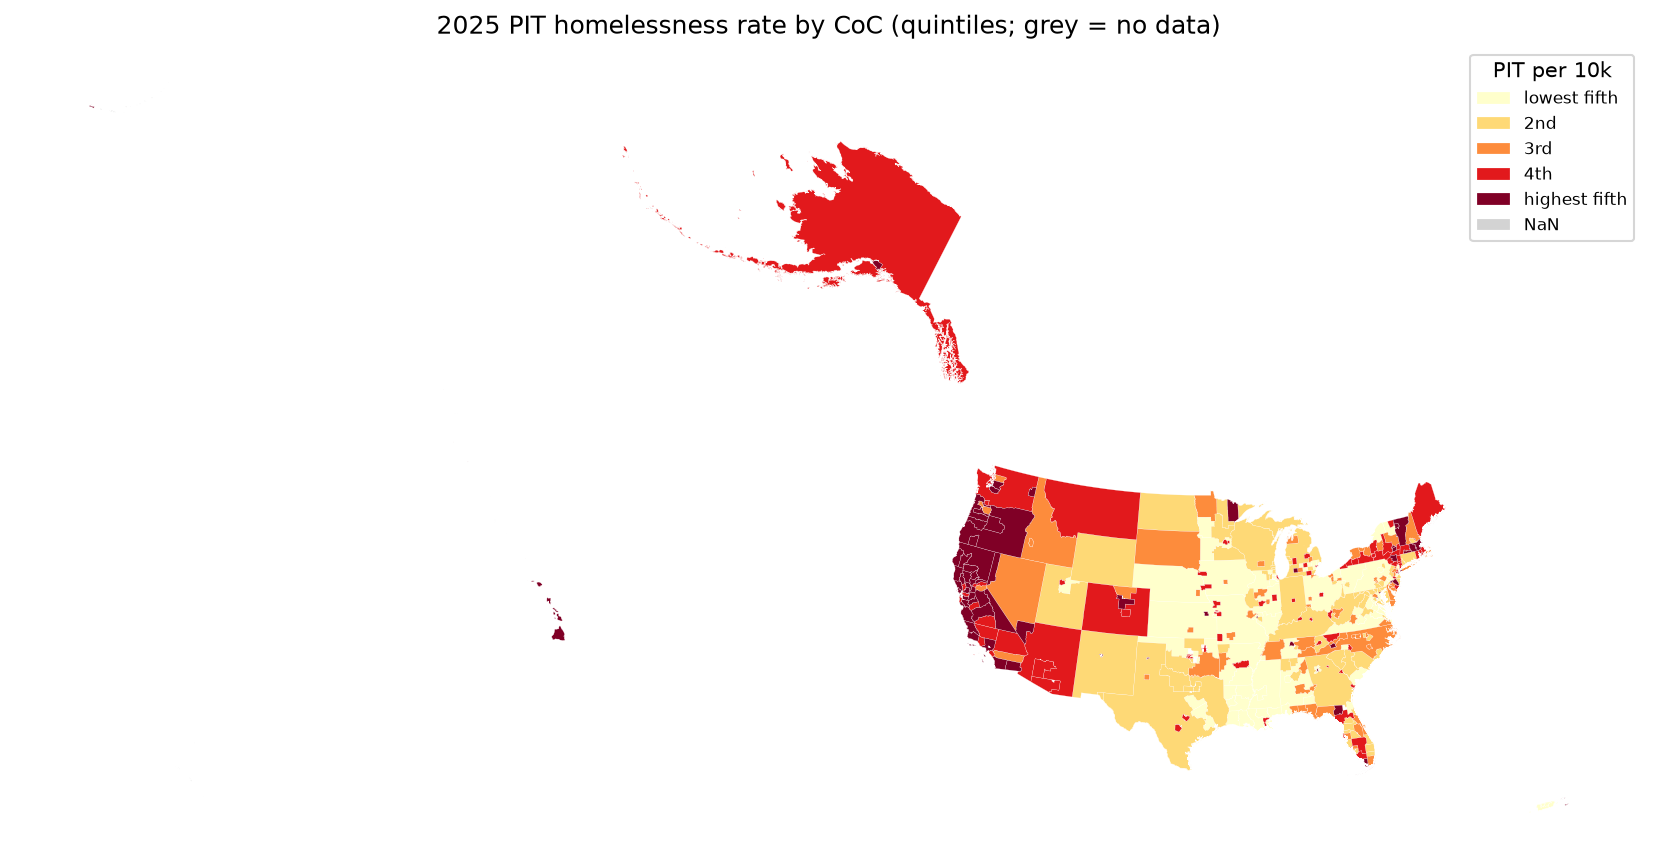
One transparency note on method: counties don't line up neatly with CoCs — about 19% of county residents live in counties split across more than one CoC. We apportioned county statistics to CoCs using block-group population weights (people, not land area). A mid-analysis audit caught a weighting bug in that step; every number in this article comes from the corrected pipeline. The headline is sensitive to this choice — see the limits section — and we state that plainly rather than burying it.
The housing side
Each housing-market variable tracks the homelessness rate in the expected direction. Substance use disorder is the strongest single correlate overall — but among housing variables, median gross rent leads, and the whole block moves together.
Explore each relationship directly — pick a variable, hover any CoC for its values. Uncertainty bars show ACS 90% margins of error (housing) or NSDUH 95% intervals (behavioral health).
The rent-to-income relationship deserves a closer look. Prior work (Glynn, Byrne & Culhane 2021) found homelessness rates rise sharply once median rent exceeds about 32% of median income. In our sample that threshold is untestable — the highest CoC sits at 30.6% — but the binned pattern shows mild saturation at the top of the rent-burden distribution, not acceleration. A linear fit does not materially understate the housing block (it changes the housing model's fit by less than half a percentage point).
The behavioral-health side
Behavioral-health indicators track homelessness rates too — SUD most strongly (r = 0.382, the highest of any single variable) — but the block as a whole accounts for less variation than housing. Two findings keep this honest rather than dismissive.
First, the result is not explained only by one survey. We tested an independent instrument — county drug-poisoning death rates from CDC death certificates, 2021–2023 — and it produced a similarly modest association. Added to the NSDUH measures it contributes little new; used alone it accounts for less variation. The pattern persists under this independent check.
Second, the BH block's measured contribution may be understated. The NSDUH substate estimates carry roughly 2 to 20 times the relative measurement noise of the ACS housing variables — estimates are statistically shrunk toward state averages, so neighboring CoCs often share identical values by construction. Part of the gap between the blocks may reflect measurement error; part may be substantive. The data cannot partition the two, so this qualification should accompany any reading of the head-to-head.
A deeper limit is conceptual, not statistical: these are general-population prevalence estimates for large substate regions. They do not measure behavioral-health conditions among people experiencing homelessness — a different quantity entirely, and one this design cannot touch.
Head-to-head: the block decomposition
The core model puts both blocks in one regression. Housing alone accounts for 20.0% of cross-CoC variation (adjusted R²); behavioral health alone 14.6%; together 33.4%. The incrementals — what each block adds after the other — are the cleanest comparison: +0.188 for housing, +0.134 for behavioral health.
The two blocks track mostly different variation: of the combined model's explained share, 56.4% is unique to housing, 39.2% unique to behavioral health, and only 4.5% shared. Assigning all the shared piece to either side would move the ordering by at most a few points — the ranking is not an artifact of how shared variance is split.
The lead new finding: a sheltered/unsheltered reversal
The most robust pattern in the sensitivity checks is a reversal between the two components of the count. Housing variables track the unsheltered rate (+0.227 incremental); behavioral-health indicators track the sheltered rate (+0.130 incremental). Each block's contribution is strongest on a different component. The pattern is descriptively consistent with how the counts are generated, though this analysis cannot test that mechanism. It also replicates on 2024 counts.
The combined headline is stable across defensible variations — except one that matters. Weighting CoCs by population (variation across people rather than communities) raises the combined fit to 0.537; per-renter-household and per-below-poverty normalizations land at 0.226 and 0.355. But apportioning by land area instead of population — a worse assumption for people-based measures — collapses the combined fit to 0.078. That collapse is a genuine validity flag, and the caveat travels with the headline: the result is crosswalk-sensitive.
Places that stand out
A few CoCs sit far above what their housing markets alone would suggest — worth a closer look by anyone who works there, not a conclusion.
Threats and limits — the short version
Seven checks highlight the main threats to interpretation. Each has a one-line verdict:
| Check | Verdict |
|---|---|
| PIT undercount — are we measuring the same thing everywhere? | High risk, touches the lead finding — undercount is plausibly correlated with the predictors (unsheltered visibility varies with climate, urban form, count effort). No design-level fix exists. |
| Behavioral-health measurement noise | High — measurement uncertainty — part of the block gap may reflect measurement error; the data cannot partition it. Read the behavioral-health contribution with that limit in mind. |
| Crosswalk sensitivity (area-weighted collapse to 0.078) | Highest sensitivity — the headline depends on apportioning by population, the pre-registered and defended choice. |
| Spatial clustering (intervals too narrow?) | Medium — residual clustering remains; published 95% intervals are a lower bound on uncertainty, not exact coverage. |
| Outliers driving the result? | Low — dropping the 10 highest-rate CoCs moves the headline by 0.003. |
| One-year fluke? | Low — the full pipeline rerun on 2024 counts replicates the headline (0.329) and the sheltered/unsheltered asymmetry. |
| Ecological fallacy | Structural — community-level associations cannot support conclusions about individuals. Individual-level questions require different data and a different design. |
What this means for practice
Four takeaways, none reaching beyond what the analysis supports:
- Rent-to-income ratios are a usable planning signal. Communities where rent consumes a large share of income consistently show higher homelessness rates. That relationship is the most replicated finding in this literature and it holds on post-2020 data.
- Behavioral-health prevalence is a service-need measure, not a homelessness predictor. High prevalence among people experiencing homelessness (about 37% alcohol-use disorders, 22% drug-use disorders in pooled studies — roughly 10× general-population rates) coexists without contradiction with weak geographic tracking. Plan services from the first fact; don't predict rates from the second.
- Sheltered and unsheltered homelessness behave differently. Housing-market variables track unsheltered rates more strongly in this analysis; the sheltered pattern is more mixed. The study describes these associations and does not test intervention strategies.
- Treat every count as a lower bound. PIT methodology varies — unsheltered counts are biennial in some CoCs, and undercount plausibly correlates with the very variables being studied. Compare with humility.
Reproducibility
Every headline figure was independently re-derived from a fresh code path and matches to the published precision. Data vintages: PIT January 2025 (HUD); ACS 2020–2024 5-year; NSDUH 2021–2023 pooled substate. Method: OLS on the PIT rate per 10,000, unweighted (one CoC, one observation), with population-weighted and sensitivity variants reported. County-to-CoC apportionment uses block-group population weights; the analysis code and crosswalks are staged in a private research repository pending the author's release decision — nothing here depends on access to it, and the vintages above are sufficient for an independent re-run from public sources.